Canada’s Housing Market To SKYROCKET End Of 2024? Experts Predict A Price Surge!

Royal LePage’s latest market forecast paints a vivid picture of Canada’s real estate landscape, predicting a significant 9% year-over-year increase in home prices by the fourth quarter of 2024. This upward revision stems from a robust first quarter, with strong price appreciation expected through the second and third quarters before tapering off towards year-end, aligning with seasonal trends.

The forecast highlights notable upgrades in major markets, particularly the Greater Toronto Area (GTA), where prices are anticipated to surge by 10%, surpassing the national average. Montreal follows closely behind with an 8.5% projected increase, while Calgary, Quebec City, and Greater Vancouver are forecasted to experience respective jumps of 8%, 8%, and 5.5%.

Royal LePage President Phil Soper attributes the current modest price rises to consumers, particularly first-time buyers, adapting to higher borrowing costs. However, he anticipates a steeper appreciation curve once the central bank enacts anticipated rate cuts, drawing in rate-focused buyers.

While easing rates will influence price upticks, the fundamental driver remains the severe housing shortage across the country. Soper warns of an intensifying seller’s market, foretelling a busy spring and fall for Canadian buyers and sellers alike.

Looking ahead, Royal LePage’s forecast suggests that by the end of 2026, the majority of mortgages will have transitioned into an elevated borrowing rate environment. Yet, this is not expected to significantly dampen the housing market’s resilience. Soper points to Canadians meeting their mortgage obligations amid record-low default rates and income growth offsetting increased mortgage costs. However, he anticipates a pullback in discretionary spending as individuals prioritize maintaining homeownership.

In summary, Royal LePage’s forecast outlines a dynamic Canadian housing market characterized by soaring prices, driven by a combination of factors including adapting consumer behavior, impending rate cuts, and the persistent housing shortage. Despite looming challenges, the market remains robust, with buyers and sellers navigating towards a seller-centric environment amidst projections of continued price appreciation.

Deep Dive: Metro Vancouver Real Estate Market Unraveled – Must-Watch Analysis! April 2024

Spring breathes new life into Metro Vancouver’s real estate scene, ushering in a wave of activity from sellers and expanding options for buyers. The latest report from Greater Vancouver REALTORS® (GVR) reveals a significant surge in MLS® listings, with a remarkable uptick of nearly 23 percent compared to the previous year.

March 2024 witnessed 2,415 residential sales in the region, marking a slight dip of 4.7 percent from the same period in 2023. Despite this minor decline, the market maintains its vigor, fueled by demand for competitively priced properties in strategic locales, shifting the balance further into sellers’ favor.

Across detached, attached, and apartment segments, new listings on the Multiple Listing Service® (MLS®) soared by 15.9 percent compared to March 2023, reaching a total of 5,002. Presently, the MLS® system boasts 10,552 properties for sale, indicating a substantial 22.5 percent increase from March 2023.

Analysis of the sales-to-active listings ratio for March 2024 reveals a robust figure of 23.8 percent across all property types. Specifically, the ratio stands at 18.2 percent for detached homes, 31.3 percent for attached homes, and 25.8 percent for apartments. These figures underscore the pressure on home prices, with ratios below 12 percent suggesting downward trends and those surpassing 20 percent indicating upward momentum.

Andrew Lis, GVR’s director of economics and data analytics, acknowledges the market’s relative cooling compared to the previous year but notes modest month-over-month price gains, ranging from one to two percent on aggregate. While Lis anticipates potential cuts to the Bank of Canada’s policy rate in 2024, he warns that these measures may not significantly ease affordability challenges, given the enduring constraints on borrowing power.

The MLS® Home Price Index composite benchmark price for all residential properties in Metro Vancouver presently stands at $1,196,800, reflecting a 4.5 percent year-over-year increase.

Breaking down the sales data, detached home sales reached 694 in March 2024, down by 5.4 percent compared to March 2023. The benchmark price for detached homes stands at $2,007,900, up by 7.4 percent from March 2023.

Apartment home sales totaled 1,207 in March 2024, marking a 7.9 percent decrease from March 2023. The benchmark price for apartments is $777,500, showing a 5.7 percent year-over-year increase.

Attached home sales witnessed a modest increase of 6.2 percent in March 2024 compared to March 2023, totaling 495 sales. The benchmark price for townhouses rose to $1,112,800, reflecting a 5 percent increase from March 2023.

In summary, while Metro Vancouver’s real estate market experiences heightened seller activity, buyers should anticipate stiff competition, particularly for attractively priced properties in sought-after locations.

Vancouver real estate market update – February 2024

The Real Estate Board of Greater Vancouver (REBGV) reported a strong start for home sales in Metro Vancouver in January 2024. Residential sales surged by 38.5% compared to January 2023, totaling 1,427 units. This increase favored sellers, signaling a shift from the balanced market conditions at the end of 2023. However, the pace of new property listings did not match the rise in sales, resulting in a 20.2% decrease from the 10-year seasonal average.

Andrew Lis, REBGV’s director of economics and data analytics, noted the unexpected strength in January sales following a quiet December. He expressed concerns about insufficient inventory potentially leading to increased competition among buyers, pushing the market back into sellers’ territory.

In January 2024, 3,788 properties were newly listed for sale, marking a 14.5% increase from January 2023. However, this figure remained 9.1% below the 10-year seasonal average. The total number of properties listed for sale in Metro Vancouver increased by 9.8% compared to January 2023, totaling 8,633 units, albeit slightly below the 10-year average.

The sales-to-active listings ratio for January 2024 stood at 17.2%, with ratios varying across property types: 11.9% for detached homes, 22.9% for attached, and 19.9% for apartments. Analysis of historical data indicated downward pressure on prices below 12% and upward pressure above 20% for a sustained period.

The forecast for 2024 predicts a 2-3% price increase by year-end, driven by demand outpacing inventory. Lis emphasized that the January figures might indicate a stronger market than initially anticipated and suggested monitoring February data to confirm trends.

The MLS® Home Price Index composite benchmark price for all residential properties in Metro Vancouver was $1,161,300, reflecting a 4.2% increase from January 2023 and a 0.6% decrease from December 2023. Sales of detached homes increased by 28% year-over-year, with a benchmark price of $1,942,400, up 7.3% from January 2023. Apartment sales rose by 30.6%, with a benchmark price of $751,900, while attached home sales surged by 82.7%, with a benchmark price of $1,066,700 for townhouses.

The data suggests a robust market at the beginning of 2024, with sales increases across property types. However, concerns linger regarding the imbalance between supply and demand, potentially affecting future market dynamics.

December 2023 Vancouver Real Estate Market Update

As of December 4, 2023, Metro Vancouver is experiencing a notable surge in housing inventory, providing home buyers with the most extensive selection since 2021. The Real Estate Board of Greater Vancouver (REBGV) reports a 4.7% increase in residential sales for November 2023 compared to the same period in 2022, totaling 1,702 sales. While this represents a 33% decline from the 10-year seasonal average, the increase in active listings is contributing to more balanced market conditions.

Andrew Lis, REBGV’s director of economics and data analytics, notes that the growing number of active listings over recent months, coupled with the typical seasonal sales slowdown, is creating a more favorable environment for buyers. In November 2023, 3,369 properties were newly listed for sale, reflecting a 9.8% increase from the previous year.

The total number of properties listed for sale on the Multiple Listing Service® (MLS®) system in Metro Vancouver has reached 10,931, marking a 13.5% increase compared to November 2022. This is 3.7% above the 10-year seasonal average. The sales-to-active listings ratio for November 2023 is 16.3%, with variations by property type: 12.7% for detached homes, 19.8% for attached, and 18.2% for apartments.

Historical data analysis indicates that home prices may experience downward pressure when the sales-to-active listings ratio falls below 12% for an extended period. Conversely, sustained ratios exceeding 20% often lead to upward pressure on home prices.

Lis points out that the current market conditions, characterized by balanced supply and demand, are contributing to flatter price trends. Following a period of over 7% price increase earlier in the year, prices have seen a slight decrease since the summer. While Cyber Monday discounts may not be prevalent, prices have edged lower by a few percentage points. Moreover, with economists predicting a modest decline in mortgage rates in 2024, market conditions are considered highly favorable for buyers.

The MLS® Home Price Index composite benchmark price for all residential properties in Metro Vancouver is $1,185,100, reflecting a 4.9% increase over November 2022. However, there is a 1% decrease compared to October 2023.

Breaking down property types, detached home sales in November 2023 increased by 7%, reaching 523 sales. The benchmark price for a detached home is $1,982,600, representing a 6.8% increase from November 2022 but a 0.9% decrease compared to October 2023.

Apartment home sales reached 850 in November 2023, showing a marginal 0.4% increase from November 2022. The benchmark price for an apartment home is $762,700, indicating a 6.2% increase from November 2022 but a 1% decrease compared to October 2023.

Sales of attached homes totaled 316 in November 2023, marking a substantial 12.5% increase compared to November 2022. The benchmark price for a townhouse is $1,092,600, showing a 6.9% increase from November 2022 but a 0.7% decrease compared to October 2023.

In summary, Metro Vancouver’s housing market is currently characterized by increased inventory, balanced conditions, and a slight decline in prices since the summer. With favorable market conditions for buyers and anticipated declines in mortgage rates, the real estate landscape in the region appears to be offering a unique opportunity for those in the market for a new home.

Everything You NEED To KNOW! Metro Vancouver Real Estate Update November 2023

The Metro Vancouver housing market remained steady in October 2023, as indicated by an increase in newly listed properties providing more options for homebuyers. However, despite this rise in listings, sales figures continued to lag behind long-term averages, reflecting a somewhat subdued demand. The Real Estate Board of Greater Vancouver (REBGV) reported 1,996 residential sales for the month, marking a 3.7 percent increase from October 2022, yet still 29.5 percent below the 10-year seasonal average.

The surge in newly listed properties, which was about 15.4 percent higher compared to the previous year, contributed to a total of 11,599 properties currently listed for sale on the Multiple Listing Service® (MLS®) system, representing a 12.6 percent increase from October 2022. Despite this rise, the sales-to-active listings ratio stood at 17.9 percent across all property types. By property type, the ratio was 12.9 percent for detached homes, 20.9 percent for attached homes, and 21.5 percent for apartments.

Market analysis indicated that the overall shift towards more balanced conditions was particularly noticeable in the multifamily segment, which remained more active than the detached segment. The real estate market experienced a relative balance between supply and demand, which restrained significant price fluctuations. While borrowing costs remained high, housing affordability was somewhat alleviated by the stabilization of prices, thus maintaining the purchasing power of buyers in the market.

The MLS® Home Price Index composite benchmark price for all residential properties in Metro Vancouver was $1,196,500, marking a 4.4 percent increase from October 2022. However, there was a slight 0.6 percent decrease compared to September 2023. Detached homes recorded 577 sales in October 2023, with a benchmark price of $2,001,400, representing a 5.8 percent increase from the previous year but a 0.8 percent decrease compared to the previous month.

Apartment home sales saw a rise of 4.9 percent, reaching 1,044 in October 2023, with the benchmark price for an apartment home at $770,200, reflecting a 6.4 percent increase from the previous year and a 0.2 percent increase from the previous month. Attached home sales totaled 356, showing a 6.6 percent increase from October 2022, with the benchmark price for a townhouse at $1,100,500, indicating a 6 percent increase from the previous year and a 0.2 percent increase from the previous month.

Overall, the market’s balanced conditions, driven by increased inventory and moderate demand, resulted in a relatively stable housing market in Metro Vancouver. Despite persistent challenges related to borrowing costs and affordability, the market remained resilient, offering some relief to prospective buyers with stabilized prices.

Top 5 things you need to know about Greater Vancouver real estate market in May 2023


A link to real estate statistics: https://members.rebgv.org/news/REBGV-Stats-Pkg-Apr-2023.pdf

Hello and welcome back to our channel! In today’s video, we will be discussing the latest real estate trends in Metro Vancouver. According to a report by the Real Estate Board of Greater Vancouver, home buyer confidence has returned, resulting in rising home prices despite a decrease in listings. Here are the five most important things you need to know from the report.

  1. Sales are rebounding: Despite the pandemic’s effects on the economy and the previous interest rate hikes, home sales in Metro Vancouver have rebounded, increasing near levels seen last spring. In April 2023, residential home sales in the region totalled 2,741, representing a 16.5% decrease from the same period in 2022, and 15.6% below the 10-year seasonal average.
  2. Low inventory levels are creating competitive conditions: There is a shortage of resale supply available relative to the pool of active buyers in the market, which is creating competitive conditions where almost any resurgence in demand would lead to price escalation, despite the elevated borrowing cost environment.
  3. Prices are increasing: The MLS HPI data shows that home prices have already increased about 5% year-to-date, outpacing the forecasted 1-2% increase by year-end. The MLS® Home Price Index composite benchmark price for all residential properties in Metro Vancouver is currently $1,170,700, representing a 2.4% increase compared to March 2023 and a 7.4% decrease from April 2022.
  4. Decrease in listings: The report shows a 29.7% decrease in the number of detached, attached, and apartment properties newly listed for sale on the Multiple Listing Service (MLS) in April 2023 compared to April 2022. The total number of homes currently listed for sale on the MLS® system in Metro Vancouver is 8,790, representing a 4.2% decrease compared to April 2022.
  5. Sales-to-active listings ratio: The sales-to-active listings ratio for April 2023 across all detached, attached, and apartment property types is 32.7%. The ratio is 24.4% for detached homes, 40.1% for townhomes, and 37.4% for apartments. When the ratio dips below 12% for a sustained period, it suggests downward pressure on home prices, while a ratio surpassing 20% over several months often leads to upward pressure on prices.

Conclusion: In summary, the Vancouver real estate market has experienced a surprising rebound in home sales, but the low inventory levels have created competitive conditions resulting in increasing home prices. The decrease in listings has contributed to a shortage of resale supply available relative to the pool of active buyers in the market. We will have to wait and see whether these price increases will be sustained into 2024. That’s all for today’s video, make sure to like and subscribe to stay up-to-date with the latest real estate news.

Greater Vancouver real estate market update for April 2023


The real estate market is currently experiencing a shortage of available inventory, which is causing a decline in seller interest in listing their properties. This is primarily due to the increase in borrowing costs, which has made it difficult for sellers to qualify for the same mortgage amount as in the past. Additionally, the stress test, which determines whether borrowers can afford mortgage payments at higher interest rates, has contributed to the decrease in inventory.

As a result of the lack of available inventory, there has been a slight increase in prices, and multiple offers are becoming more common. Many buyers who have been waiting on the sidelines are now ready to enter the market, but there are not enough properties to meet the demand. While statistics may not paint the full picture, current indicators suggest that prices are unlikely to decrease and may even continue to rise slightly, which is worth noting for potential buyers.

In addition to the limited inventory in the real estate market, the rental market is also strong, particularly in Vancouver, which remains the most expensive city in Canada to rent. The average cost of a one-bedroom unit in Vancouver is $2640, while a two-bedroom unit costs $3632. Burnaby also ranks as the third most expensive city in Canada for rent, with one-bedroom units costing $2282 and two-bedroom units costing $3175.

This strong rental market can be attributed to the shortage of available properties for rent, causing demand to exceed supply, resulting in a competitive rental market. Landlords have the upper hand, and tenants often must pay a higher price for a desirable rental property. While this may not be ideal for renters, it does present opportunities for investors looking to purchase and rent out properties in these cities.

Overall, the current state of the real estate market is due to a combination of factors, including the rise in borrowing costs, the stress test, and the lack of available properties for rent. While this has led to a slight increase in prices, it is unlikely to be a dramatic change. However, those looking to buy or rent in Vancouver or Burnaby should be aware of the current state of the market and the high associated costs.

Are multiple offers back? – Greater Vancouver Real Estate Market Update March 2023

The Vancouver real estate market is experiencing a surge in multiple offer situations due to a low inventory of available properties. This trend is especially clear in a condo and the townhouse markets in Greater Vancouver. However, the current trend is different from the past as these multiple offers are much closer to the listing price. In the past, during multiple offer situations, properties would sell for 10 or even 20 percent over the listing price.

The Vancouver real estate market has been one of the hottest and most competitive markets in North America for the past several years. The city’s picturesque location and robust economy have attracted many buyers, making it difficult for many first-time homebuyers to enter the market. This situation has been exacerbated by a low inventory of available properties.

The low inventory of available properties has created a competitive environment for buyers, and as a result, multiple offer situations have become more common. In a multiple offer situation, several buyers make an offer on the same property, which can drive up the price. However, in the past, during these multiple offer situations, the price would often exceed the listing price by a significant margin.

Today, the situation is different. Buyers are still making offers on the same properties, but the offers are much closer to the listing price. This trend is likely due to several factors. Firstly, buyers are becoming more educated and savvy about the market. They are aware of the risks of overbidding and are therefore more cautious. Secondly, historically high interest rates makes it much harder to qualify for mortgages.

The shift towards more reasonable offers is a positive development for both buyers and sellers. Buyers are more likely to get the property at a fair price, while sellers can sell their property without worrying about overpricing or underpricing.

However, the competitive environment created by the low inventory of condos and townhouses is still present, and multiple offer situations are still happening. Buyers need to be prepared and do their due diligence before making an offer. They should have a good understanding of the market and the value of the property. It’s also important to work with a reputable real estate agent who can guide them through the process.

In conclusion, the Vancouver real estate market is experiencing a surge in multiple offer situations due to a low inventory of available properties. However, the current trend is different from the past as these multiple offers are much closer to the listing price. This is a positive development for both buyers and sellers and is likely due to increased education and transparency in the market. Buyers should still be prepared for a competitive environment and do their due diligence before making an offer.


Top 5 Tips for the Greater Vancouver Real Estate Buyers in the Fall of 2022

If you’re a buyer in greater Vancouver area in the fall of 2022 I have some good news for you. The market seems to be in your favour. You probably have heard of crazy bidding wars, subject free offers and real estate selling for well over the asking price. At the moment the market is slower and this could present a great opportunity to buy. This doesn’t mean that you should buy. That part is really up to you. In this post I am hopping to provide you with 5 tips that would make your buying experience smoother. 

 1. Get a mortgage pre-approval 

I know you’ve probably heard this tip a hundred time already. But it’s more relevant than ever before. First of all the interest rates have been on the rise. By getting a mortgage pre-approval you can lock-in current interest. This is especially valuable if interest rates go up in the future. Second reason why you want to get a mortgage pre-approval is knowing how much you can borrow. Maybe you’ve gotten a mortgage pre-approval a few months ago, and you’re hopping to be approved for the same mortgage amount. Unfortunately with rising interest rates you might be surprised how much your borrowing power is being effected. Chances are you will qualify for a lower mortgage amount than before witch in turn will dictate your real estate budget. 

So before going out there and looking for real estate you should get a mortgage pre-approval. 

 2. Take your time looking. Start early. Get some experience.

When the market was really active buyer felt a lot more pressure to buy quickly. If you waited to long there was a chance to get priced out of the market. Places that used to cost $500,000 now cost $550,000 and some buyers simply couldn’t afford such price increases. 

The story is different now. The market for the most part is flat in some cases the prices are even declining. Which is a good news for the buyers. Now you can take your time looking for that perfect property that hits most of your requirements. There isn’t as much urgency behind trying to buy something quickly. In this type of market buyers usually have more choices and are overall more satisfied with their purchases. 

 3. Don’t drag your feet. Trying to time the market is impossible. When you see something that you like be ready to pull the trigger. 

This might seem counter intuitive to the previous point but let me explain. Because, there is less urgency to buy sometimes buyers can fall into the trap of thinking “what else is out there?”. I like this unit and it hits everything in our criteria but “what else is out there?” or “maybe a better unit will come to the market next week?”. Sometimes people are trying to time the market perfectly and buy at the lowest price possible. But that’s impossible. If there was a way to time the market perfectly that would be fantastic but unfortunately there isn’t. 

I’ve seen this happen so many times especially with firs time buyers. They find a place that they really like but they fall into the trap of thinking that there might be a better unit out there. Or maybe the prices will go down even lower. We would not make an offer on the unit that buyers really like and the unit would sell to someone else. Months would go by and a similar unit would not come up again. 

Don’t rush to buy but also don’t drag your feet. If the unit that you really like and hits most of your criteria is available take action quickly and secure it. You don’t know when another similar unit will come up for sale. 

 4. Negotiate. And know what places are going for. You don’t want to be unreasonable. But in a current market buyers can score some great deals.

Because the market is a bit slower at the moment you, as a buyer, have more leverage to negotiate and try to lower the price. Of course you have to be reasonable but now is the time to try to negotiate. It’s important to know what is the current value of the property you’re interested in. Sometimes sellers might be unrealistic and they want to sell their property for the prices from 8 months ago. It’s crucial for you and your real estate agent to do the homework and to figure out a fair market value for the property. 

 5. Make sure to do your inspections and document reviews. Because the market is slower buyers have the ability to review documents properly and to order an inspection. 

Slower market means that subject free offers are almost non-existent. Most offers that I see today include conditions: such as subject to financing, subject to reviewing strata documents, subject to inspection, subject to insurance and a few others. Don’t be hesitant to include the subjects that work in your favour, subjects that would allow you to perform due diligence. I would especially recommend to carefully read strata documents if you’re buying a strata unit. And don’t be afraid to ask many questions. Pay attention to potential or current problems with the building and make sure to review insurance information. 

I hope you will find those tips useful. Feel free to share this post with anyone who you think will find it useful. And good luck with your search. 

If you’re in the market you might be interested in my monthly real estate newsletter. Here is a link: https://www.myvancouverproperty.ca/insider

Thanks for reading:)

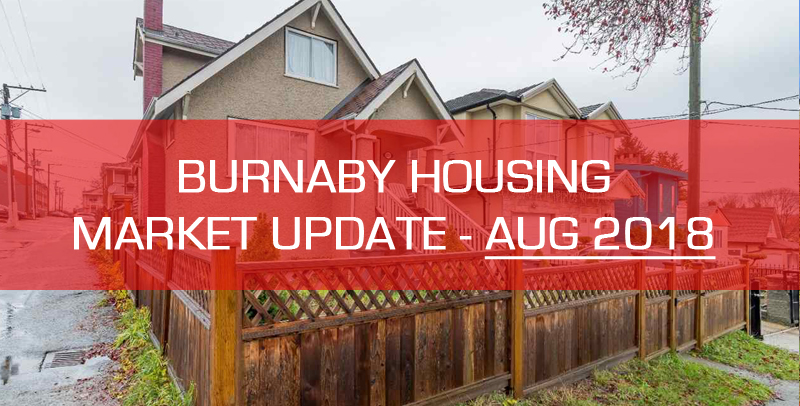
Burnaby BC detached housing market update for August 2018

MLS Home Price Index

MLS Home Price Index for the detached houses in Burnaby in August 2018 (see graph below)

Burnaby East: $1,269,200 | -3.9% (change since August 2017)

Burnaby North: $1,501,200 | -5.8% (change since August 2017)

Burnaby South: $1,621,000 | -5.6% (change since August 2017)


Average Sales Price

Average Sales Price of the detached houses in Burnaby in August 2018 (see graph below)

Burnaby East: $1,384,823 | -0.4% (change since August 2017)

Burnaby North: $1,749,432 | +1.2% (change since August 2017)

Burnaby South: $1,765,238 | -2.2% (change since August 2017)


Average Percent of Original Price

Average Percent of Original Asking Price of the detached houses in Burnaby in August 2018 (see graph below)

Burnaby East: 96.1% | +0.1% (change since August 2017)

Burnaby North: 94.4% | -1.2% (change since August 2017)

Burnaby South: 90.3% | -2.9% (change since August 2017)


Total Inventory

Total Inventory of the detached houses in Burnaby in August 2018 (see graph below)

Burnaby East: 67 | -5.6% (change since August 2017)

Burnaby North: 218 | -7.2% (change since August 2017)

Burnaby South: 254 | -6.3% (change since August 2017)


New Listings

All New Listings of the detached houses in Burnaby in August 2018 (see graph below)

Burnaby East: 11 | -47.6% (change since August 2017)

Burnaby North: 53 | -30.3% (change since August 2017)

Burnaby South: 47 | -35.6% (change since August 2017)


Total Sales

Sales of the detached houses in Burnaby in August 2018 (see graph below)

Burnaby East: 7 | +75.0% (change since August 2017)

Burnaby North: 22 | -31.3% (change since August 2017)

Burnaby South: 12 | -58.6% (change since August 2017)


Sales to Actives Ratio

Sales to Active Listings Ratio of the detached houses in Burnaby in August 2018 (see graph below)

Burnaby East: 0.104 | +85.7% (change since August 2017)

Burnaby North: 0.101 | -25.7% (change since August 2017)

Burnaby South: 0.047 | -56.1% (change since August 2017)