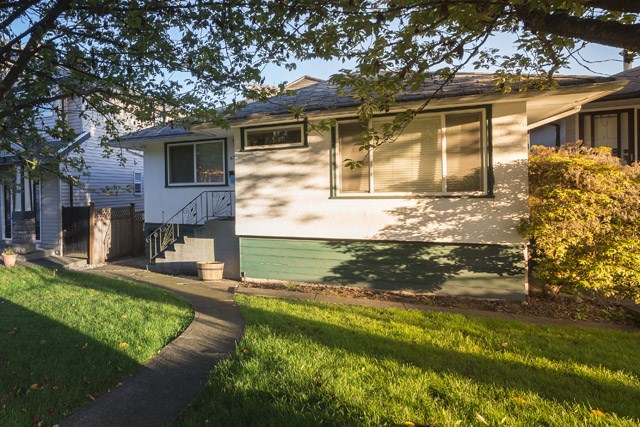
Here is a detailed breakdown of the Burnaby detached housing market for November 2016 and for the past 3 years. In this breakdown I will solely focus on detached houses in Burnaby South, Burnaby North and Burnaby East areas. We will only look at the resale properties, brand new construction is not included.
See all houses for sale in Burnaby BC here.
*All of the market statistics and graphs were taken from the Real Estate Board of Greater Vancouver.
Lets start with Average Sales Price of Houses in Burnaby in November 2016 and for the past 3 years (see graph below)
Burnaby: $1,491,466 | +6.9% (change since November 2015)
The sales price is up by almost 7 percent as compared to November 2015. However, we see a significant drop in the sales price as compared to Spring and Summer of 2016. Prices started to dip in August of 2016, right around the time “foreign buyers tax” was introduced.
Next, lets have a look at the Average Percent of Original Price sellers in Burnaby are getting for their houses in November 2016 and for the past 3 years (see graph below)
Burnaby: 94.2% | -7.0% (change since November 2015)
There is a small decline in the percentage of then original price as compared to November of 2015. If we compare current average percent of original price with the average percent of original price in Spring and Summer of 2016 the different is substantial. At the hight of the market this year seller were receiving offers 5-10% over their original asking price.
Next, Total Inventory of Detached Houses for Sale in Burnaby in November 2016 and for the past 3 years (see graph below)
Burnaby: 394 | +60.8% (change since November 2015)
We see substantially more inventory on the market this November as compared to November 2015. However, total inventory for this November is still right around the 10 year average.
Now, lets take a look at the Number of New Listings on the Market in Burnaby BC in November 2016 and for the past 3 years (see graph below)
Burnaby: 82 | -7.9% (change since November 2015)
There are actually fewer new listings on the market this November as compared to November 2015. The number of new listings in November 2016 is around the 10 year average.
Lets take look at Total Number of Sales in Burnaby in November 2016 and for the past 3 years (see graph below)
Burnaby: 48 | -55.1% (change since November 2015)
The total number of sales for November 2016 is less than a half of sales in November 2015. The number of sales for this November is alarmingly low, some of the lowest numbers we’ve seen in the last 10 years. If the sales don’t pick up in 2017 we might have a lot of leftover inventory which might cause prices to dip even more.
Lastly, lets have a look at Sales to Active Listing Ratio for house in Burnaby in November 2016 and for the last 3 years (see graph below)
Burnaby: 0.122 | -72.1% (change since November 2015)
We are currently in a “buyers market”. In November 2015 we had a strong “sellers market”. Real estate market for detached houses has shifted from “sellers market” to “buyers market” in July 2016. The “foreign buyers tax” (introduced in August 2016) has added breaks to the already slowing down market.
The increasing amount of inventory with the lack of buyers’ demand might cause house prices in Burnaby to dip even more in the near future.
I hope you found this article helpful. If so, please, share it with someone who’s looking for a house in Burnaby or someone who owns a Burnaby home and would appreciate the extra information.
