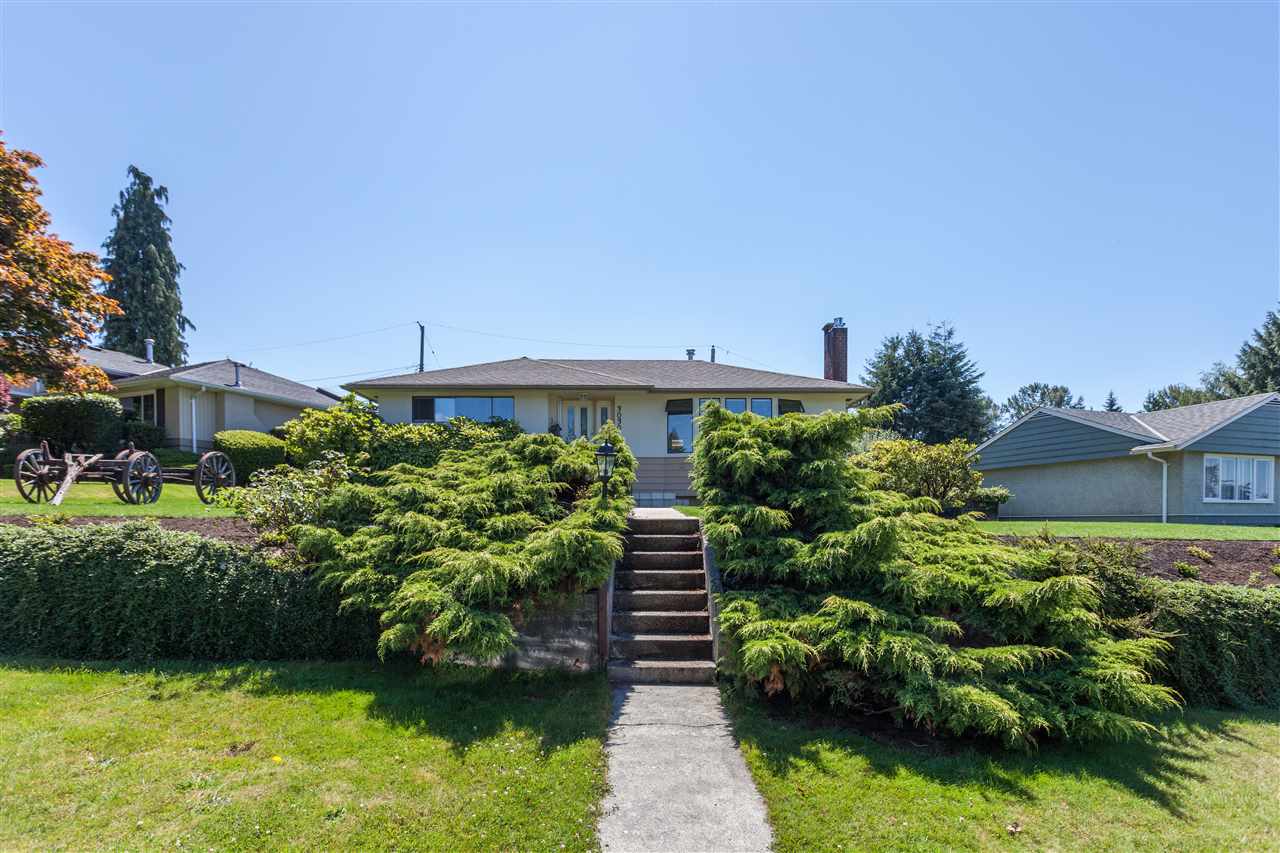
Here is a first look at Burnaby housing market at the beginning of 2017. We will focus on detached housing market in January 2017. New construction homes are not accounted for. Townhouses and condos are also excluded from the statistics. You can see one bedroom condo market breakdown here.
Average Sales Price for detached houses in Burnaby in January 2017 (see graph below)
January 2017: $1,498,939 | -2.0% (change since January 2016)
December 2016: $1,591,140
The average sale price for detached properties in Burnaby has not changed much in the last few months. Since the end of summer of 2016 we’ve seen housing prices decline quite a bit. We see a slight decline in the prices in January 2017.
Average Percent of Original Asking Price for detached houses in Burnaby in January 2017 (see graph below)
January 2017: 90.8% | -14.3% (change since January 2016)
December 2016: 93.5%
Home sellers in Burnaby were selling their homes for about 10% under their original asking price. Quite a shift from spring and summer when homes were selling for close to 10% over the asking price.
Total Inventory of detached houses in Burnaby for sale in January 2017 (see graph below)
January 2017: 319 | +59.5% (change since January 2016)
December 2016: 278
Unlike Burnaby condo market, Burnaby housing market has a healthy amount of available inventory. We’ve seen a drop in the inventory levels in December 2016. Now a lot of the same listings are going back on sale.
Number of New Listings of detached houses in Burnaby for sale in January 2017 (see graph below)
January 2017: 161 | +3.9% (change since January 2016)
December 2016: 39
Number of the new listings in January is usually relatively low. However, there were quite a few new listings on the market this January.
Total Number of detached houses in Burnaby sold in January 2017 (see graph below)
January 2017: 39 | -57.1% (change since January 2016)
December 2016: 40
We had good levels of inventory but the sales of detached houses in Burnaby this January were low. The buyer demand for detached houses has slowed significantly.
Sales to Active Listings Ratio for detached houses in Burnaby in January 2017 (see graph below)
January 2017: 0.122 | -73.2% (change since January 2016)
December 2016: 0.14
Based on sales to active listings ratio Burnaby detached housing market in January was a buyers market.
In conclusion, prices have levelled off. Inventory levels are increasing but the buyer demand is not. The next few months will be very important for the Burnaby housing market. If we don’t see more buyer demand prices might go down even farther.
